Dataset Catalog#
The repository ships with multiple HDF5 datasets stored under datasets/<name>/. Each folder contains data.hdf5 (train/test/val splits), optional parameter sets, and metadata such as timesteps. Datasets are typically produced via the codes.create_dataset helper described in :doc:guides/extending-benchmark, which ensures a consistent layout:
train/test/val: arrays with shape(n_samples, n_timesteps, n_quantities).Optional
*_params: per-trajectory parameters (e.g., radiation field, metallicity).timesteps: explicit timeline (logarithmic or linear).Attributes such as
n_quantities,n_parameters, and train/test/val counts for quick inspection (older datasets may infer these values on the fly).
When you add new datasets, follow the same convention so the CLI can auto-discover everything.
Dataset |
Source |
|---|---|
|
|
|
|
|
|
|
|
|
|
|
|
|
|
|
|
|
|
|
|
|
|
|
|
|
|
|
|
|
|
|
Visualisations#
For each dataset we usually publish a quick set of plots (trajectories, gradients, distributions, random example). Generate or refresh them via:
python datasets/_data_analysis/analyse_all_datasets.py
The script iterates over the list called datasets inside datasets/_data_analysis/analyse_all_datasets.py. To visualise a new dataset, append its identifier there and add an entry to the dictionary defined in datasets/_data_analysis/dataset_dict.py. Each entry specifies whether to plot on a log scale, how many quantities per subplot (app), and the plotting tolerance (controls axis limits). The script then produces PNGs under each dataset folder.
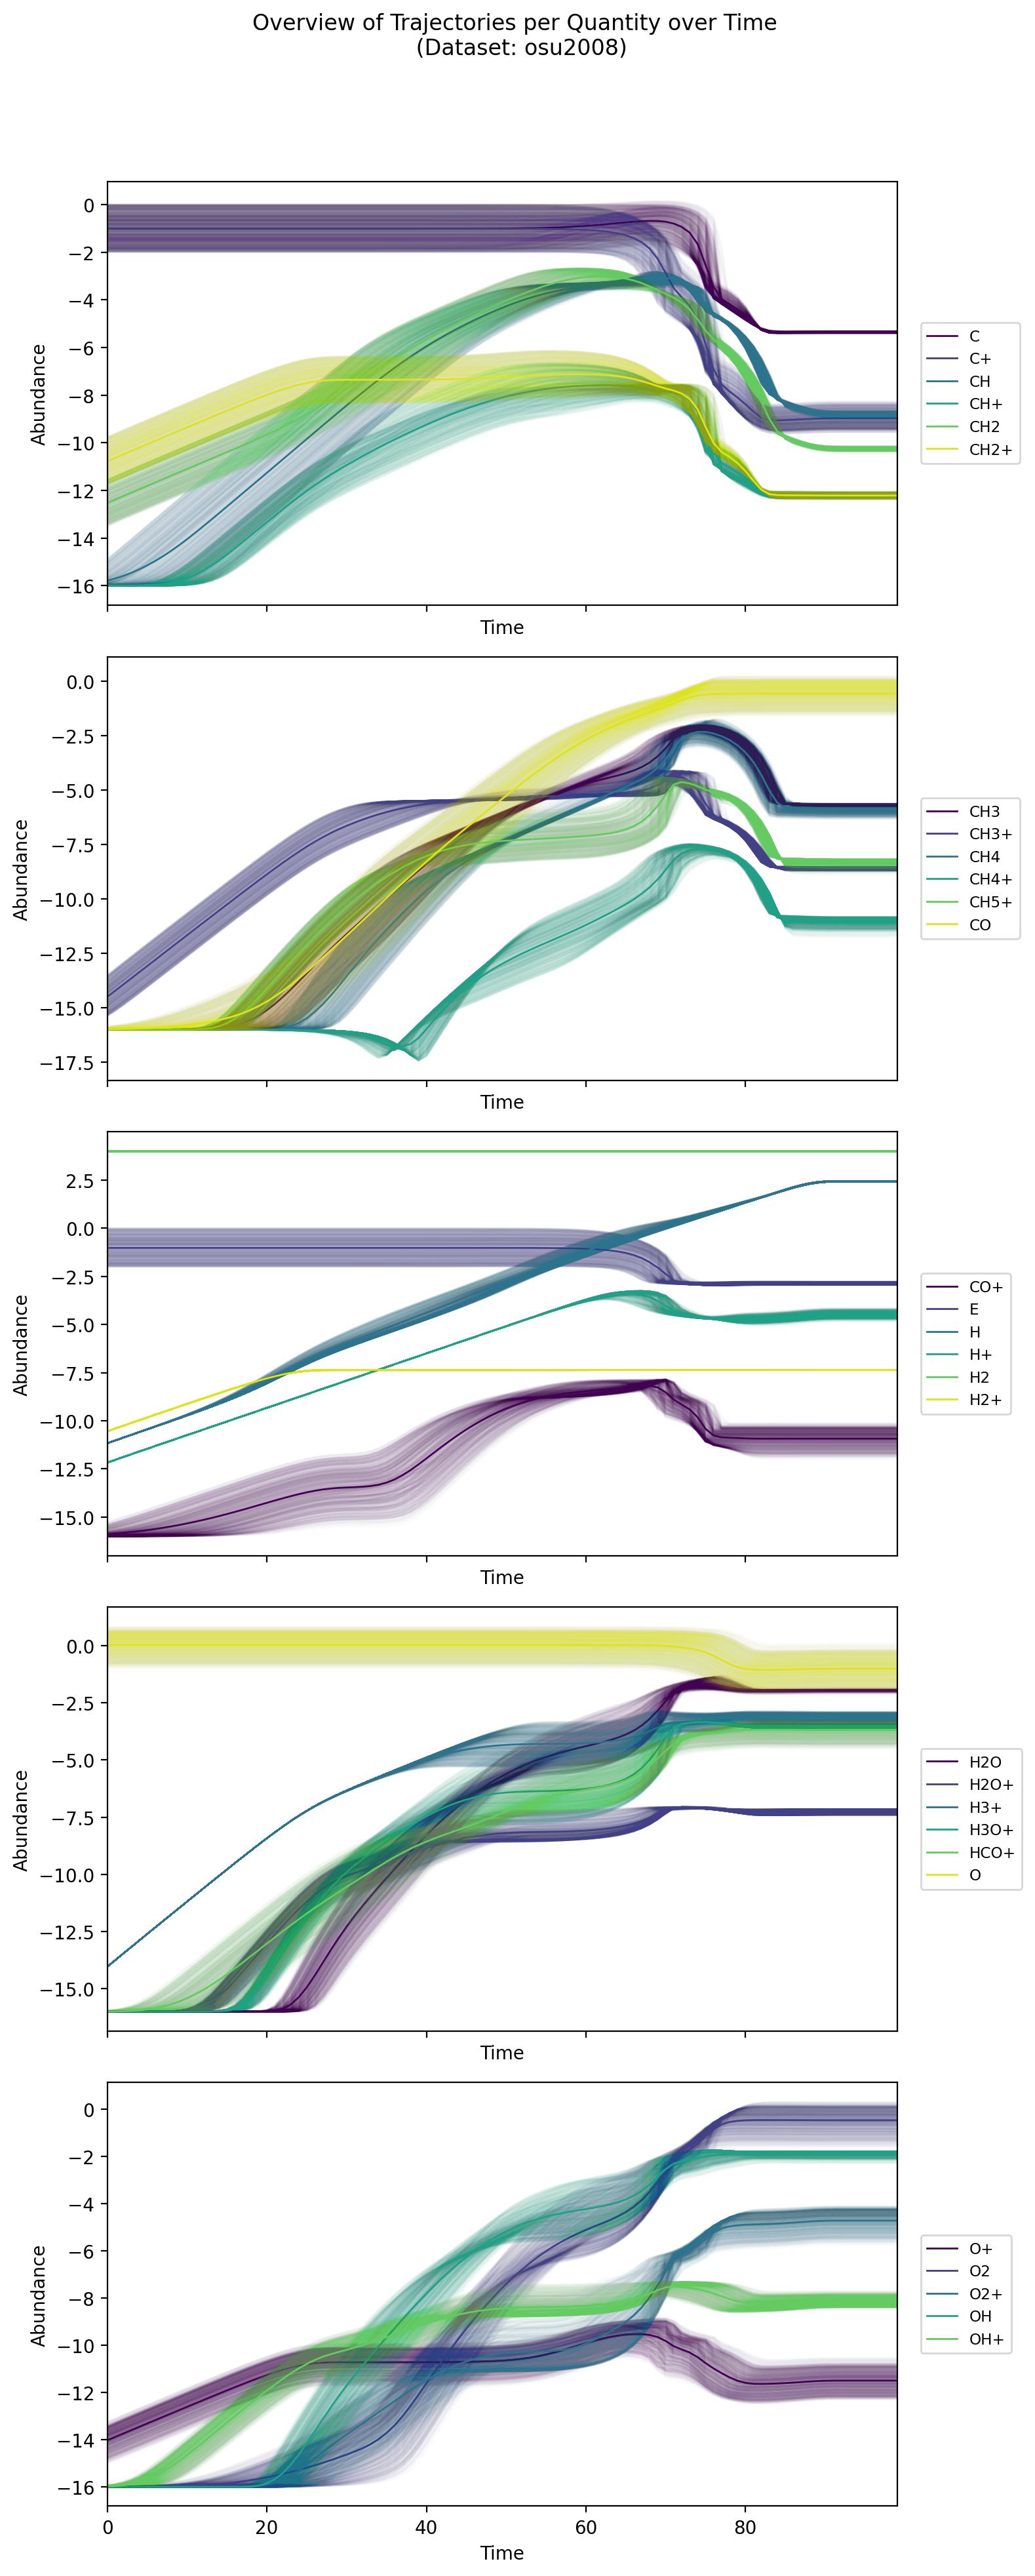
Example visualisation (osu2008) showing the log-scale trajectories generated by the helper script.#
Download helper#
You rarely need to download anything manually: the training, tuning, and evaluation CLIs call download_data on demand, which uses the URLs defined in datasets/data_sources.yaml. The first time you reference a dataset, its data.hdf5 is fetched and cached under datasets/<name>/. Keep data_sources.yaml up to date if you mirror the data in your own storage.